

It’s Monday morning. You ask your team how last week went, and you get a round of “good” and “lots of leads.” Nobody’s lying. But nobody can tell you how many enquiries actually came in, who’s sitting on leads they haven’t called, or which source is quietly wasting your ad spend.
That’s not a team problem. It’s a reporting problem.
Most real estate sales managers run on gut feel and WhatsApp updates. The numbers exist somewhere in a portal inbox, a spreadsheet, three people’s heads but never in one place at the same time. So the weekly review becomes a guessing game, and the leaks you can’t see are the ones that cost you bookings.
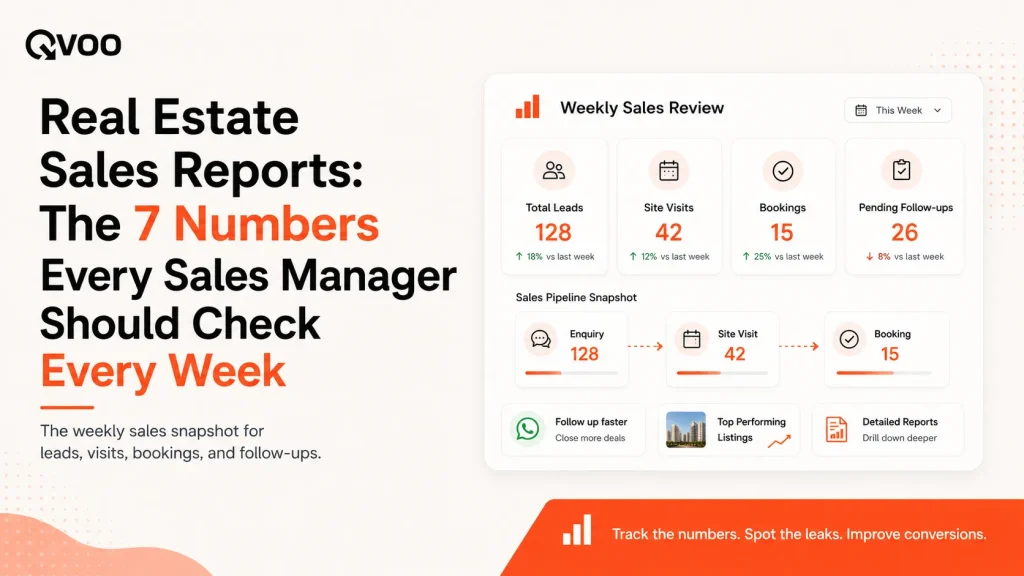
This is a simple fix. You don’t need thirty metrics or a data analyst. You need about seven numbers, checked every week, that tell you whether your pipeline is healthy and where it’s stuck. Here’s the list and how to actually see each one without chasing anybody.
Why “we had a good week” isn’t a report
A real estate sales report does one job: it turns activity into a decision. Did more leads come in or fewer? Are visits happening? Is anyone holding leads they’ve gone quiet on? Should you spend more on 99acres or less?
If a number doesn’t change what you do on Monday, it’s not worth tracking. That’s the test for everything below. Each of these seven tells you something you can act on this week reassign a lead, call a source rep, push a stuck deal, or coach a team member.
Track them weekly, not daily. Daily numbers are noise; a missed call today might just be lunch. Weekly numbers show the pattern.
The 7 numbers every real estate sales manager should track
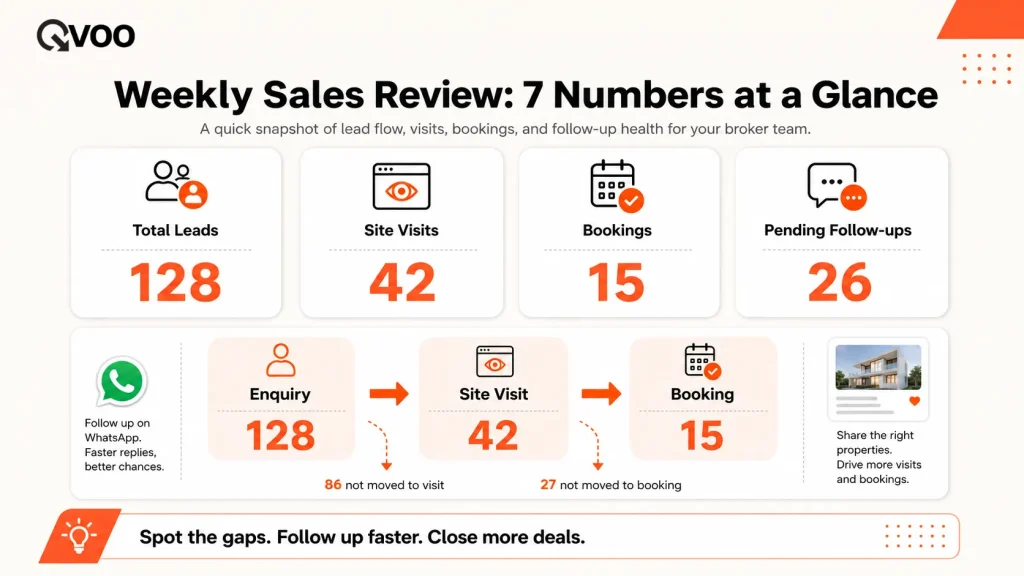
1. New leads this week and where they came from
Start with the top of the funnel. How many fresh enquiries landed, broken down by source: 99acres, MagicBricks, Housing.com, Meta and Google Ads, and your website forms.
This one number answers two questions at once. Is demand up or down? And which channel is actually feeding you? A source that brings ten leads a week but zero site visits is costing you money, not making it.
2. Leads with no owner
Every unassigned lead is a lead nobody is calling. This is the most common silent leak in a brokerage an enquiry comes in over the weekend, lands in a shared inbox, and sits there until it’s cold.
Your weekly target for this number is zero. Anything above zero is a list of calls that haven’t happened yet.
3. Site visits booked and completed
Site visits are the strongest buying signal in real estate. A lead who shows up has skin in the game. Track both how many were scheduled and how many actually happened the gap between the two is your no-show problem, and no-shows are usually a follow-up problem.
4. Bookings (and your visit-to-booking rate)
This is the number your business actually runs on. Count bookings for the week, then look at the ratio of bookings to completed site visits. If visits are high but bookings are low, the deal is breaking at the last stage negotiation, paperwork, or follow-up not at the top of the funnel.
5. Pending follow-ups
How many follow-ups are due or overdue across the team? This is the difference between a pipeline that moves and one that quietly stalls. Most lost deals aren’t lost to a competitor; they’re lost to silence. A rising pending-follow-up count is an early warning that someone’s overloaded or coasting.
6. Stuck leads (and which stage they’re stuck in)
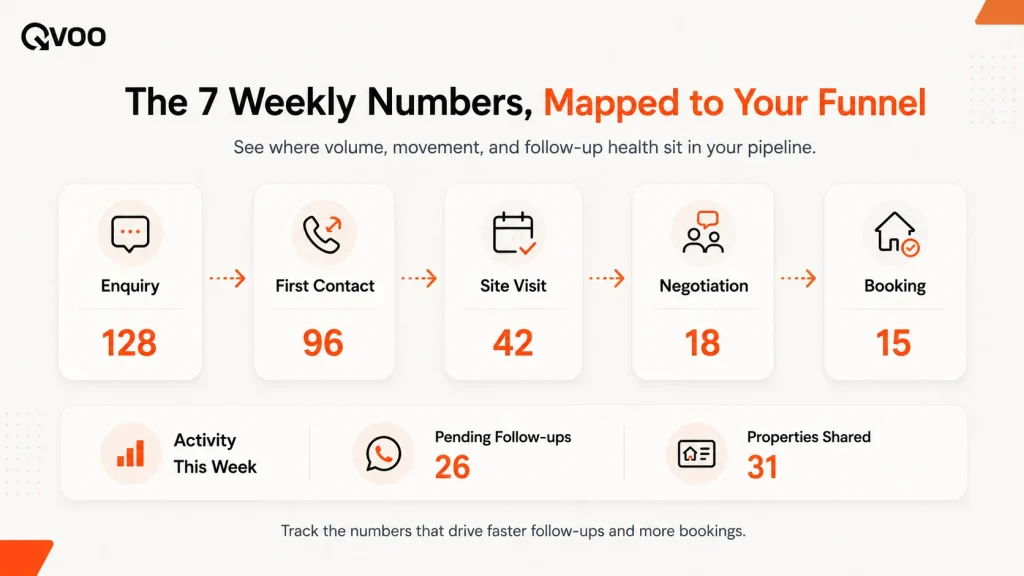
Pull every lead that hasn’t moved a stage in, say, 14 days. Then group them by stage. A pile-up at “Site Visit” means visits aren’t getting scheduled. A pile-up at “Negotiation” means deals are stalling on price or paperwork. The stage where leads bunch up tells you exactly where to coach.
7. Performance by team member
Finally, the same picture per person: leads handled, visits done, bookings closed, follow-ups pending. Not to police anyone to spot who’s drowning and who’s quietly carrying the team. A rep with 80 open leads and 30 overdue follow-ups doesn’t need a lecture; they need some of those leads reassigned.
If you want to learn more of how you can do better with sales pipeline management look at the QVOO Blog explained on sales pipeline.
How to see these without chasing your team
Here’s the honest part: if these numbers live in a spreadsheet, you’ll update them once and never again. The only version of this that survives a busy month is one where the report builds itself from the work your team is already doing.
That’s the whole point of running on a CRM instead of Excel. Qvoo CRM currently helps real estate teams manage enquiries, follow-ups, property leads, sales pipeline, and bookings from one place built on a scalable platform with a broader CRM vision for more industries in the future. Because every enquiry, call, visit, and stage change is recorded as it happens, the weekly report is just a view of data that’s already there.
A few ways that plays out in practice:
- Put your four most-watched numbers on the dashboard. In Qvoo, you can configure the top KPI cards on your dashboard pick the module and metric for each, like total leads this week, completed site visits, pending follow-ups, or bookings. The cards update on their own and are clickable, so tapping “Pending follow-ups” takes you straight to that list. Managers see the whole workspace; each salesperson sees their own numbers.
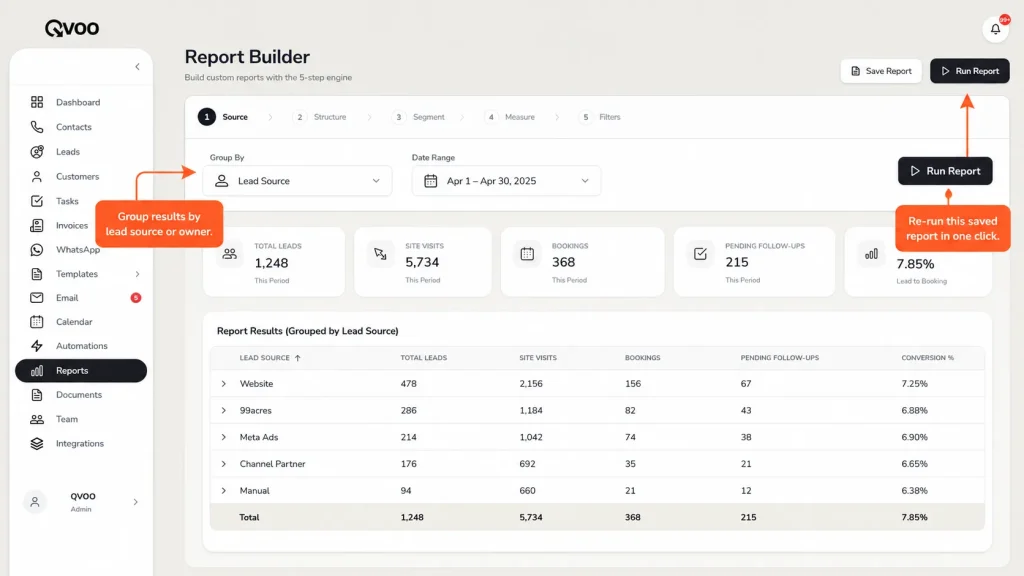
- Build the deeper cuts in the Report Builder. For source mix, stuck leads, or per-person performance, Qvoo’s Report Builder walks you through a short five-step setup: pick your source (leads, site visits, and so on), choose how to group the rows (by source, by owner, by stage), set what to count, and apply a date range. You can save the report and re-run it every Monday in one click instead of rebuilding it each week.
- Let the calendar close the loop on activity. Because follow-ups and site visits are scheduled in the calendar, completed-versus-pending counts are real, not self-reported. That’s what makes numbers 3 and 5 trustworthy.
Make it a 15-minute Monday habit
A report nobody reads is just a prettier spreadsheet. The value is in the rhythm. Block 15 minutes every Monday and walk the seven numbers in order: leads in and from where, anything unassigned, visits booked and done, bookings and the conversion rate, follow-ups pending, stuck leads by stage, and performance by person.
By the time you finish, you’ll have three or four concrete actions reassign these five leads, call the 99acres rep about quality, push these two stuck deals, lighten one rep’s load. That’s a sales review. Everything else is just “good week.”
Conclusion
Real estate sales reports aren’t about dashboards for their own sake. They’re about seeing the leaks while you can still fix them. Seven numbers, fifteen minutes, every Monday that’s enough to run a tight pipeline and stop losing deals to silence.
If your numbers still live in someone’s head or a spreadsheet that’s three days stale, that’s the first thing to fix. With a CRM like Qvoo, the report builds itself from the work your team already does so you spend Monday deciding what to do, not assembling the data.
Want to see your own weekly numbers in one view? Book a Qvoo demo and we’ll show you the dashboard and reports set up for a real estate team.
Look at your Business Insights with Reports and Grow effectively
Your business insights data suggest where your business is falling back and where you have a strong hold. So you can make correction in loosen ends and make your business stronger.
Explore QVOO today to find out different type of reports, automations, management offered.
Explore how QVOO helps you scale:
👉 QVOO Leads
👉 QVOO Calendar & Site Visits
👉 QVOO Team Permissions & Reporting
Frequently Asked Questions
What KPIs should a real estate sales manager track?
Keep it to about seven you’ll actually review weekly: new leads by source, unassigned leads, site visits booked and completed, bookings and your visit-to-booking rate, pending follow-ups, stuck leads by stage, and performance per team member. If a number won’t change a decision this week, drop it.
What is a real estate sales report?
It’s a regular summary of your sales activity and pipeline how many leads came in, where from, how many turned into site visits and bookings, and what’s stalled. The best ones update automatically from your CRM so the data is current, not three days old.
How often should I review sales reports?
Weekly is the sweet spot for a sales manager. Daily numbers are too noisy to act on, and monthly is too late to fix a leak. A 15-minute Monday review catches problems while you can still do something about them.
Can I track leads by source like 99acres and MagicBricks?
Yes if your leads are tagged with their source on capture. In Qvoo, you can group a report by source to see how many leads, site visits, and bookings each channel produced, which tells you where your ad spend is actually working.
Do I need a separate analytics tool for real estate sales reports?
Usually not. A CRM that records your leads, follow-ups, visits, and bookings can produce these reports directly. Qvoo includes configurable dashboard KPI cards and a 5-step Report Builder, so you don’t need a separate BI tool for a weekly sales review.
How is this different from sales pipeline tracking?
Pipeline tracking shows where each lead sits right now. Sales reporting is the weekly read on the whole team trends, conversion rates, and who needs help. You need both: the pipeline for live deals, the report for the patterns behind them.